Dashboard
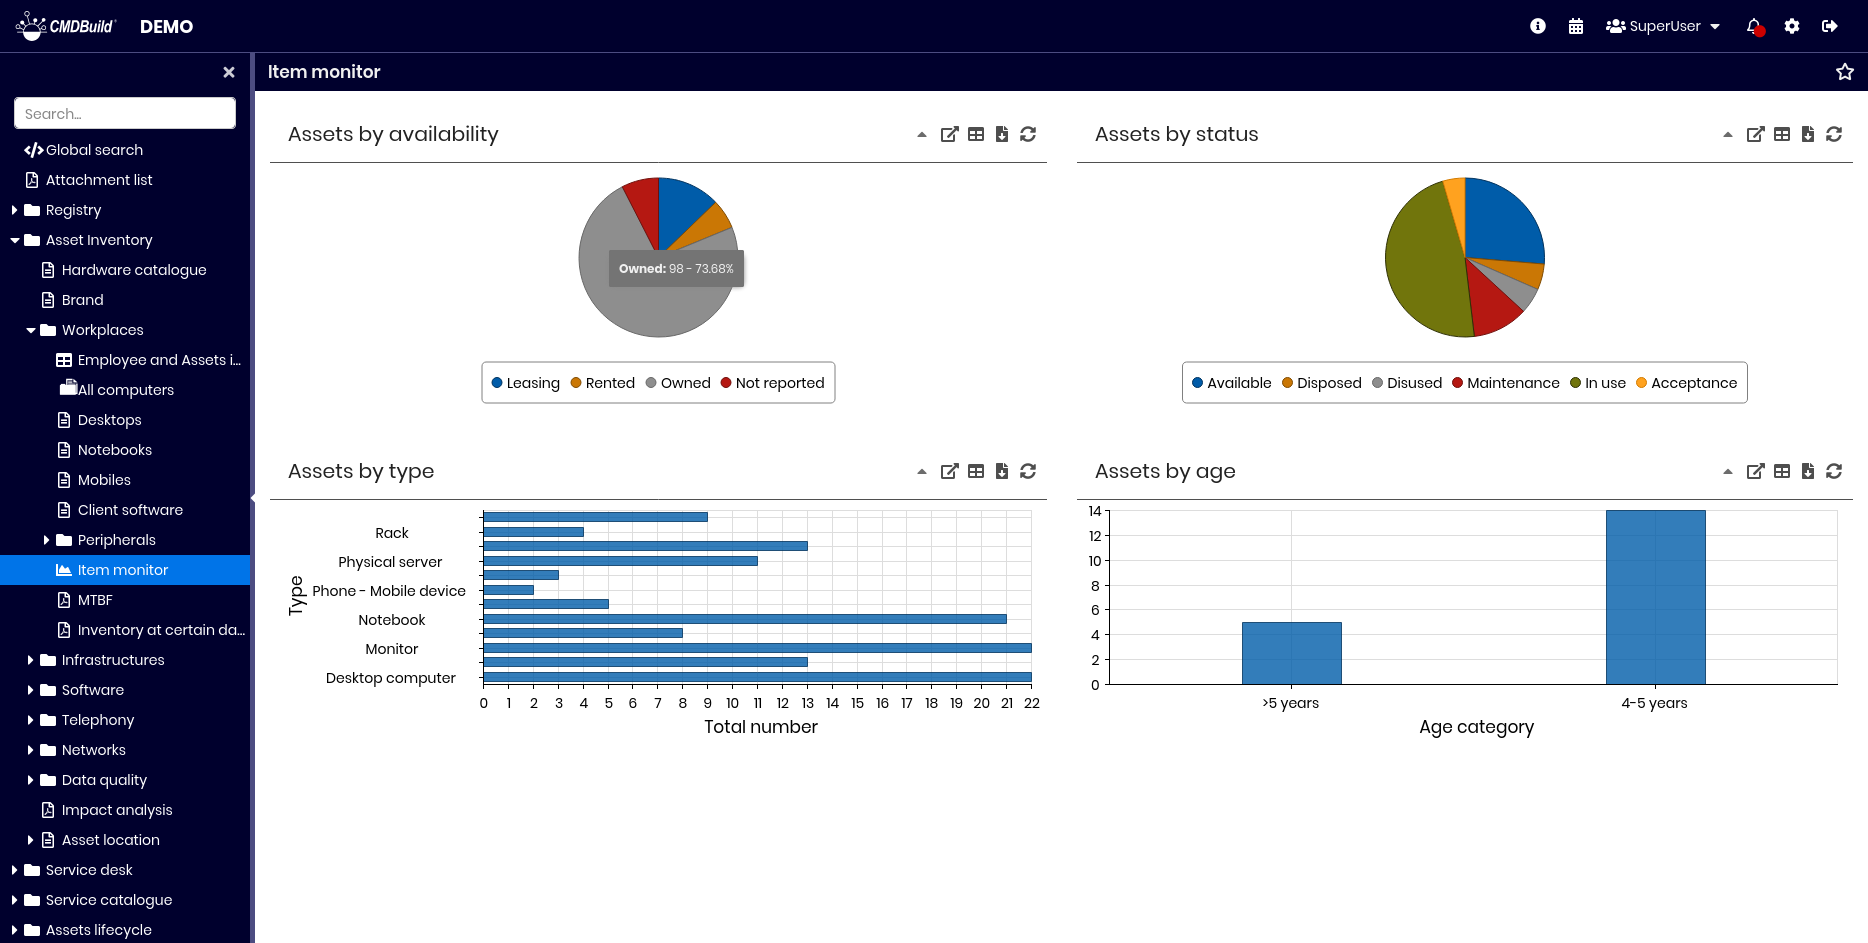
CMDBuild provides the ability to configure dashboard pages, each dedicated to monitoring specific aspects such as asset status, service desk performance, cost allocation and more.
A dashboard is composed of various components, including charts (bar, gauge, line, pie), data tables and texts.
As with all CMDBuild components, dashboards are configured in the Administration Module and can then be added to the Navigation Menu of the Management Module.
Dashboard consultation
For each dashboard element, the following operations are available:
- expand or collapse the element panel
- view the chart in a popup
- show or hide the controls used to edit parameters
- show or hide the full list of values used for chart calculations
- download chart data
- refresh the chart
Some charts may also include:
- required parameters
- a button to load data after completing the parameters
The following example shows how to set a parameter for a calculation function within a chart.
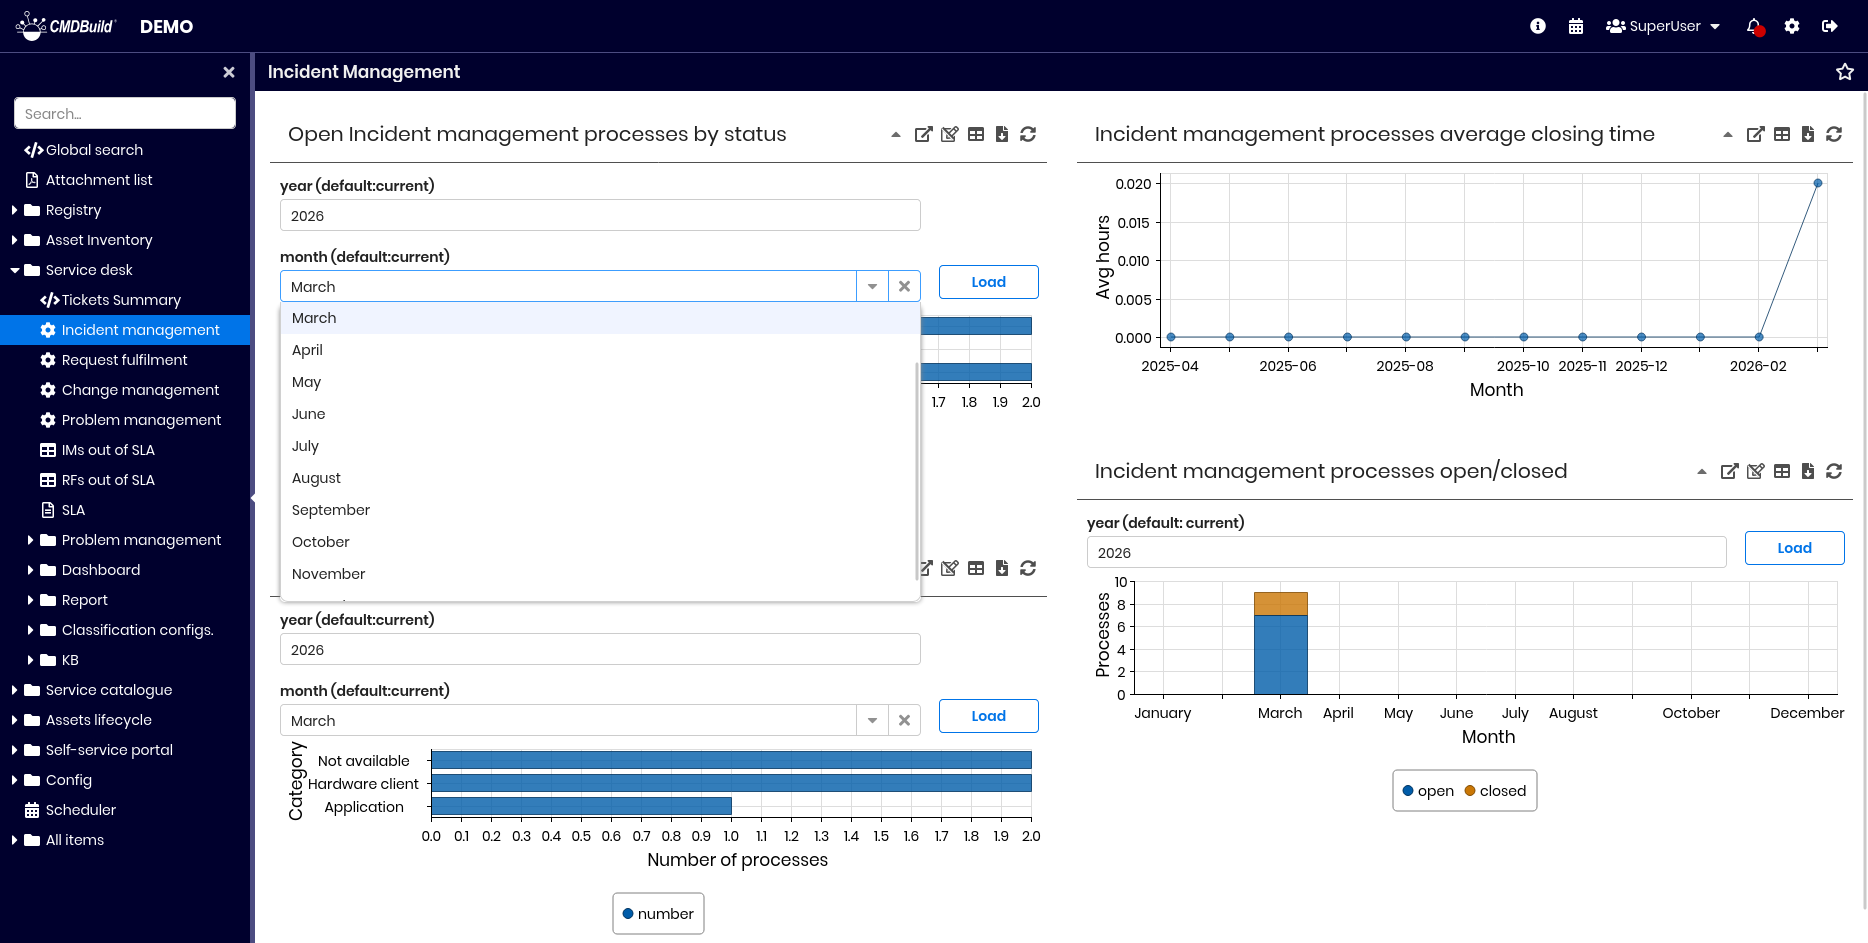
The next example shows how to request and display the list of values used to generate a chart.

Dashboards are implemented using dedicated components of the Ext JS library, the same framework on which the entire CMDBuild user interface is based.