Dashboard
CMDBuild allows configuring dashboard pages that contain charts, tables and textual elements. These dashboards can then be viewed in the Management Module.
Each dashboard can focus on a specific area, such as asset classification (age, frequency, usage), service desk performance (SLA), economic indicators or other metrics relevant to system monitoring.
Dashboards support a customizable layout, allowing the Administrator to define the number of rows and columns and the width of each cell.
Data displayed in charts is retrieved through PostgreSQL functions created by the Administrator according to a predefined template.
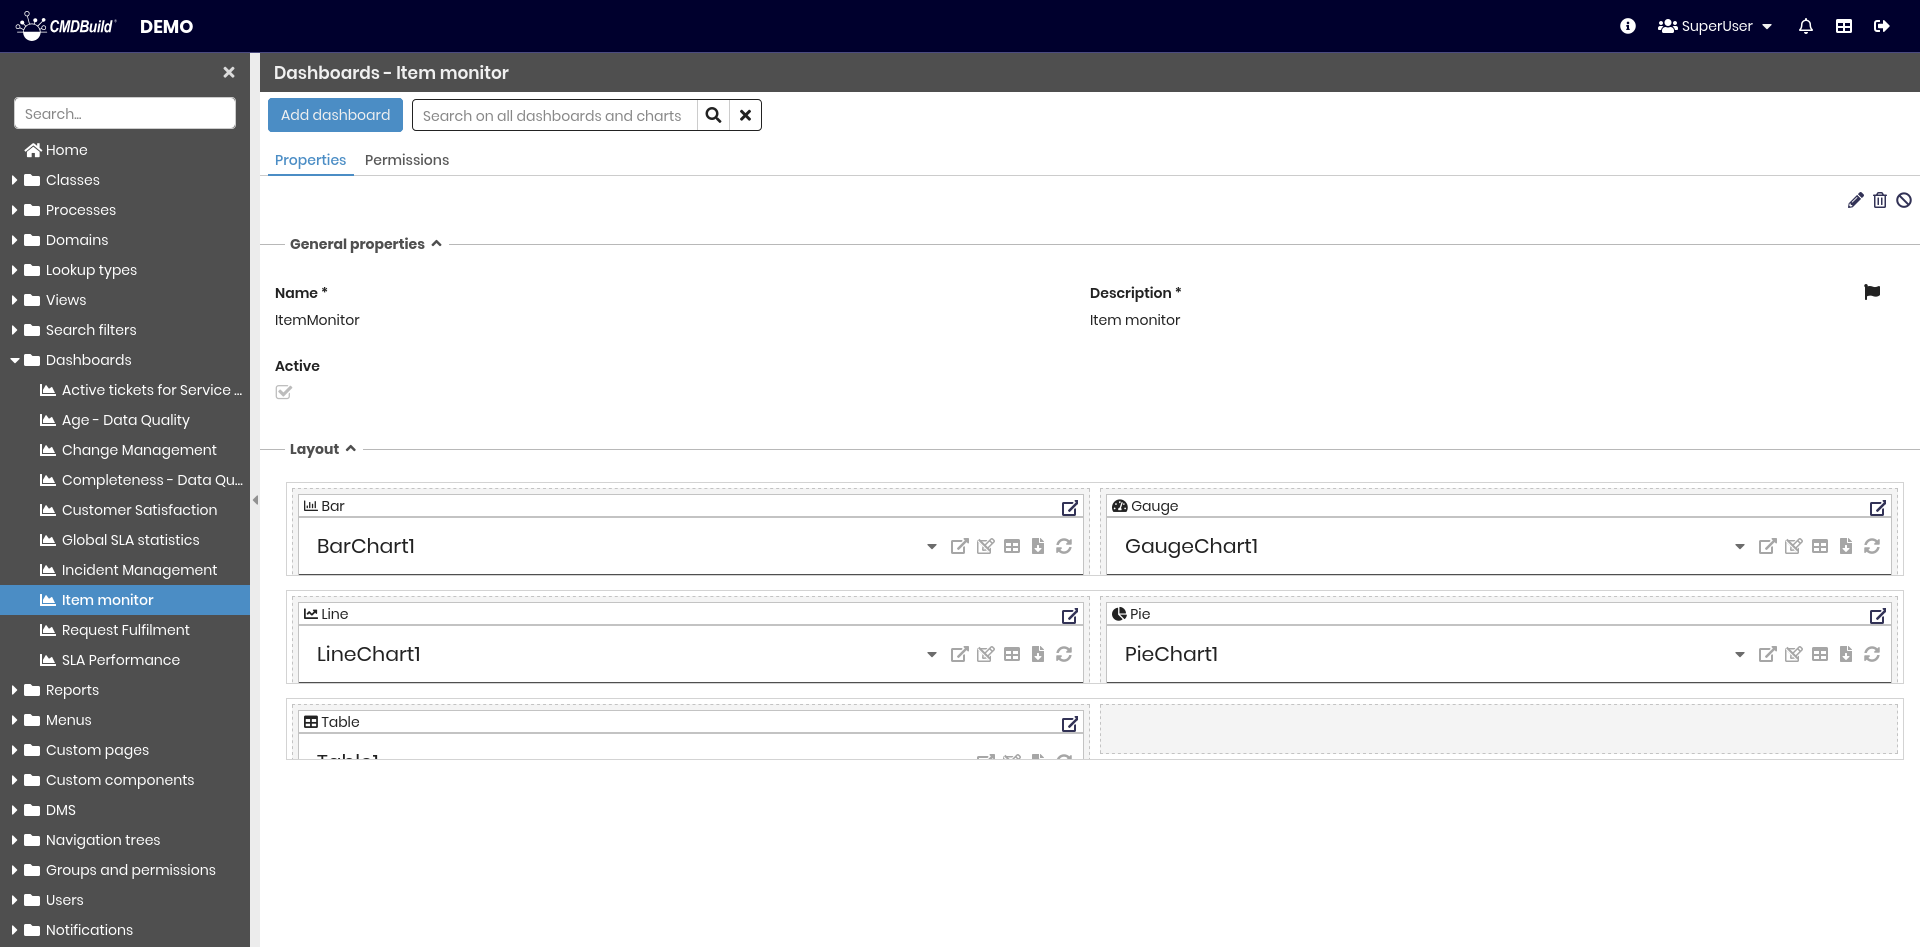
Properties Tab
This section allows creating new dashboards and editing existing ones.
Available operations include:
- creating a new dashboard
- searching among existing dashboards
- editing a dashboard
- deleting a dashboard
- disabling a dashboard (marking it as inactive)
Each dashboard requires metadata configuration, layout definition and the configuration of each dashboard element.
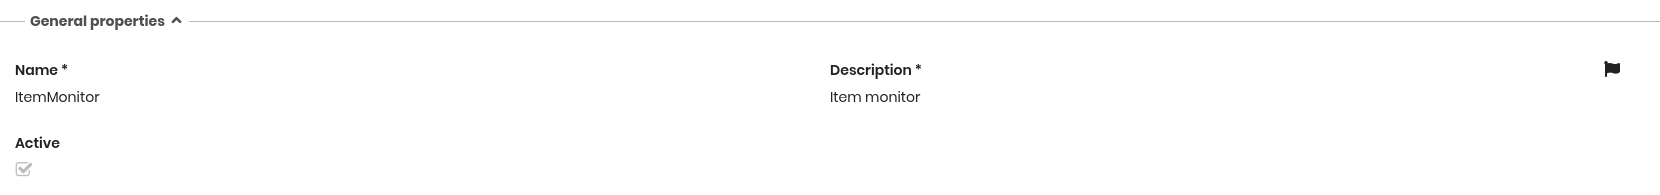
General Properties
The following information is required:
- Name: dashboard name
- Description: dashboard description. This field is localizable by selecting the flag icon, which opens a popup window for translation into the enabled languages
- Active: enables or disables the dashboard
Layout
When defining the dashboard layout, the following actions are available:
- creating a new row
- removing a row
- moving a row up
- moving a row down
- adding a new column
- removing a column
- adjusting column proportions
- placing elements in the layout using drag and drop
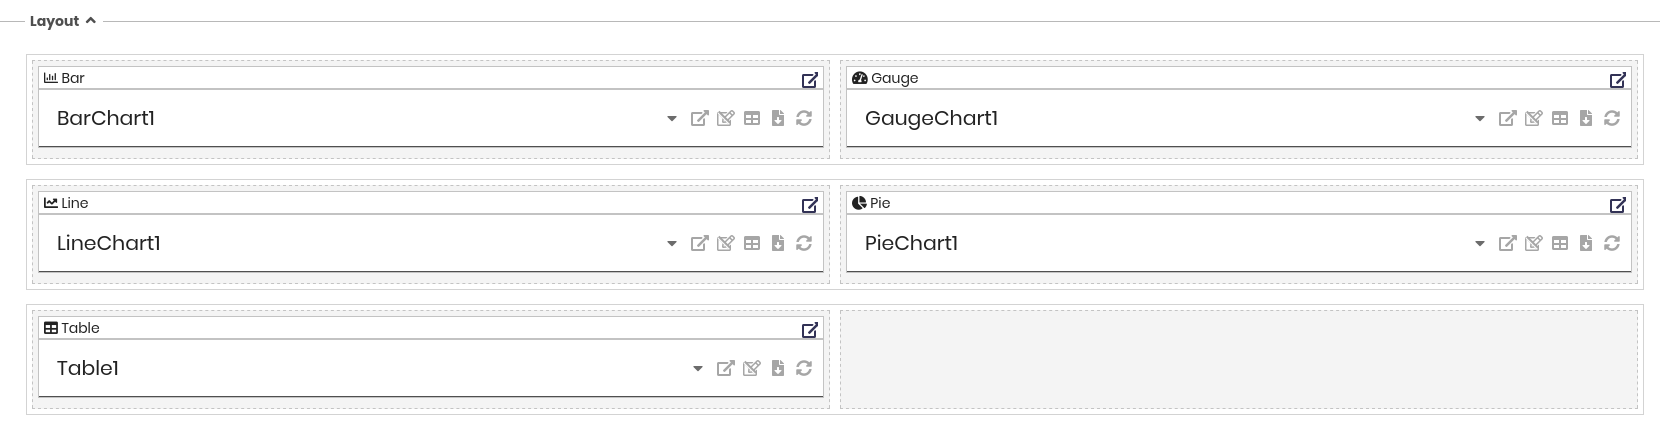
Chart Configuration
All chart types share a common configuration structure composed of two main sections:
- General properties
- Data source
These sections define the basic behaviour of the chart and how data is retrieved from the system.
After these shared settings, each chart type provides additional configuration options specific to its visualization model.
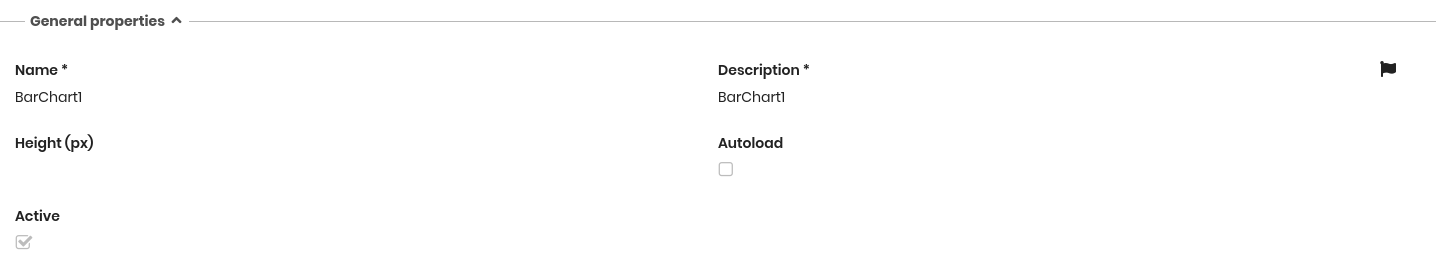
General Properties
- Name: unique identifier of the chart
- Description: label displayed to the user. This field is localizable by selecting the flag icon, which opens a popup window for translation into the enabled languages
- Height (px): height of the chart in pixels
- Autoload: if enabled, the chart loads automatically when opening the dashboard
- Active: enables or disables the chart
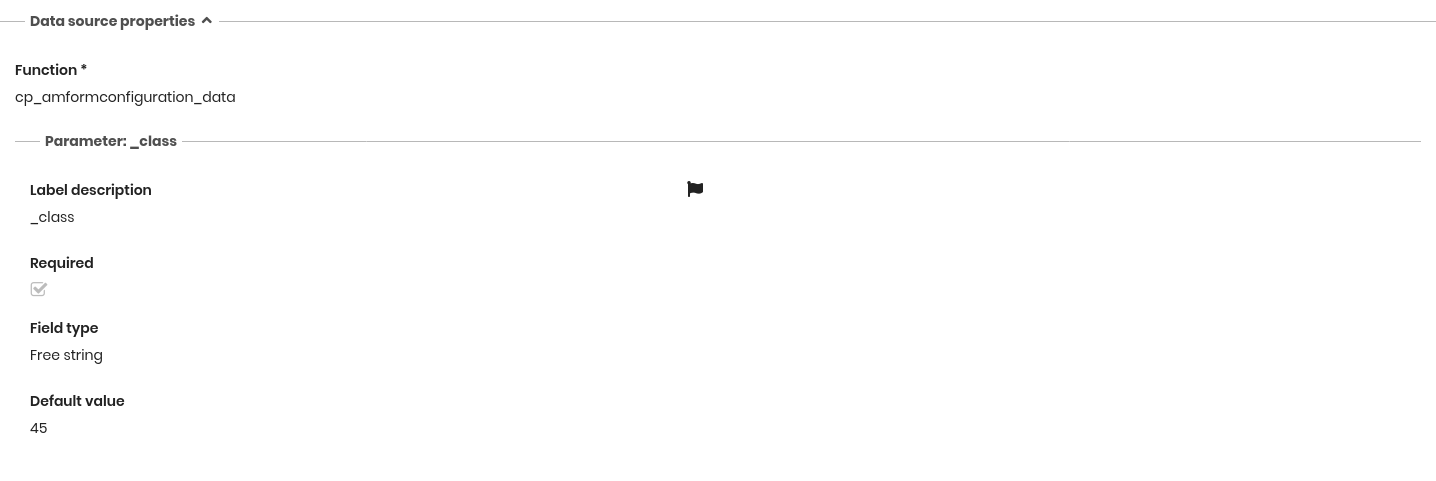
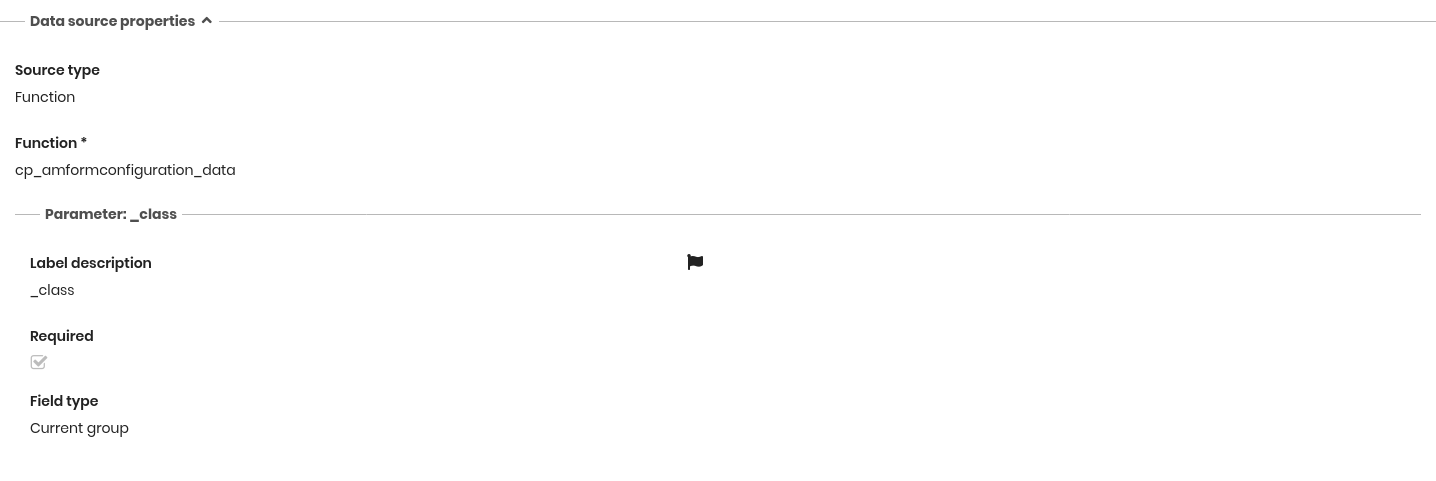
Data Source
Charts rely on a PostgreSQL function created according to the specifications described later.
Once the function is configured, a fieldset is automatically generated for each parameter (if the function includes parameters).
Each parameter requires the following settings:
- Label: text shown to the user. This field is localizable by selecting the flag icon
- Required: indicates whether the parameter is mandatory
- Field type: determines how the parameter is displayed
- Decimal or Date: no additional configuration required
- String: choose between free string, class name, current user or current group
- Integer: choose between free number, lookup value ID (with lookup and filter selection) or card ID (with class and filter selection)
- Default value: optional initial value
Specific Chart Configurations
Each chart type provides additional configuration properties on top of the common sections described above.
The following paragraphs describe the specific options available for each chart type.
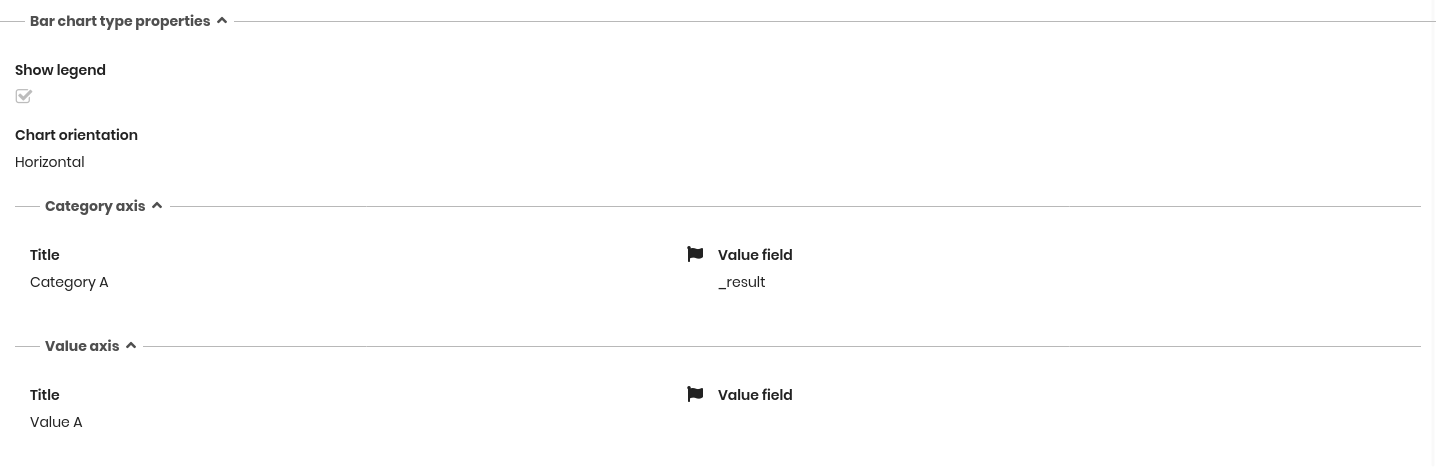
Bar Chart Configuration
The following properties can be configured for bar charts.
Chart Properties
- Show legend: displays or hides the chart legend
- Axis orientation: horizontal or vertical orientation
Category axis
- Title: category axis label. This field is localizable by selecting the flag icon
- Value field: field returned by the function used as category
Value axis
- Title: value axis label. This field is localizable by selecting the flag icon
- Value fields: one or more fields used to define bar values


Line Chart Configuration
Line charts share the same configuration options as bar charts.
All general properties, data source settings and chart‑specific properties are configured in the same way.
For details, refer to the Bar Chart Configuration section.
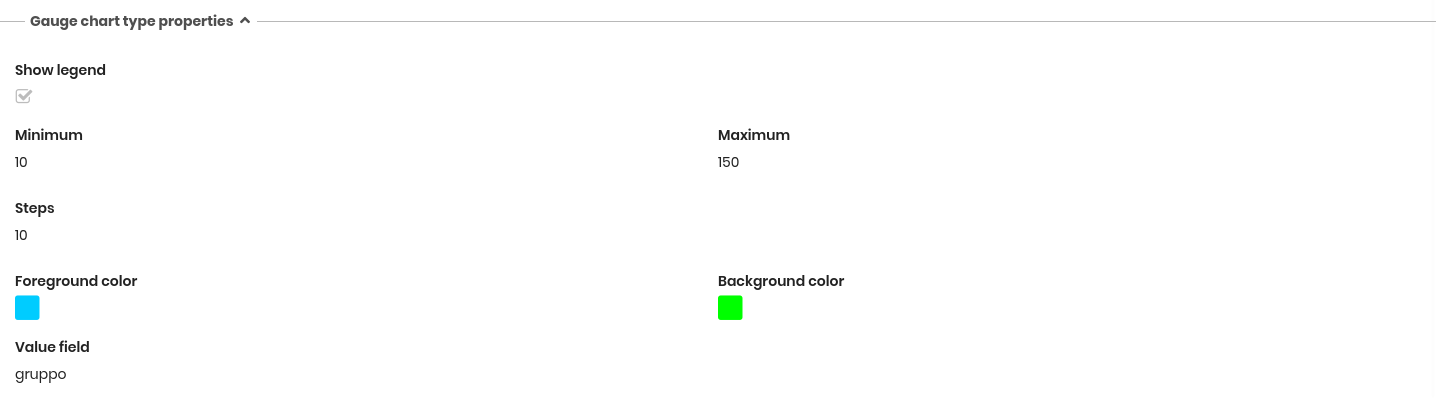
Gauge Chart Configuration
Gauge charts share the common General properties and Data source settings described above.
The following properties are specific to gauge charts.
Chart Properties
- Show legend: displays or hides the chart legend
- Minimum: minimum scale value (defaults to 0 if not specified)
- Maximum: maximum scale value
- Steps: number of scale intervals
- Foreground color: color used for the active portion of the gauge
- Background color: color used for the inactive portion of the gauge
- Value field: function output field used as the indicator shown in the gauge
Pie Chart Configuration
Pie charts share the common General properties and Data source settings described above. The following properties are specific to pie charts.
Chart Properties
- Show legend: displays or hides the chart legend
- Label field: label shown for each slice. This field is localizable by selecting the flag icon
- Value field: function output field used to define the size of each slice
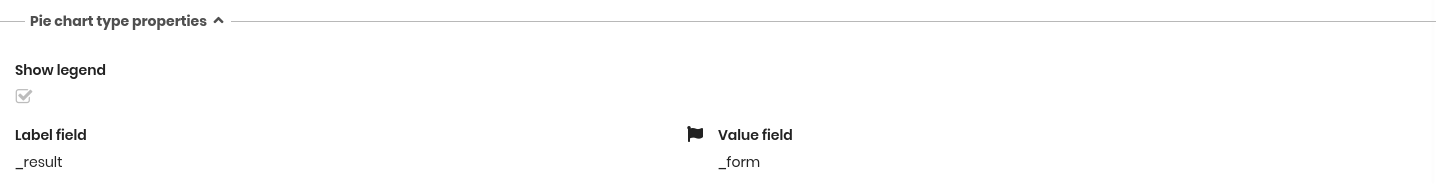
Table Chart Configuration
Table charts share the common General properties and Data source settings described above.
Additionally, table charts provide specific options to define how data is retrieved and displayed.
Source Type
For table charts, it is possible to configure the data source by selecting one of the following options:
- Function: data retrieved through a PostgreSQL SQL function
- Class: data retrieved directly from a class
- View: data retrieved from a configured view
Text Chart Configuration
Text charts allow inserting custom HTML content to be displayed within the dashboard.
The configured HTML is rendered as static text inside the selected dashboard cell and can be used to provide descriptions, titles, contextual information or custom formatted content.
Permissions Tab
This section allows configuring permissions on the current dashboard for specific user groups.
Permissions determine which groups can access the dashboard.
For details on permission management, refer to the relative section.
SQL Function Requirements
Charts that rely on a data source of type Function require a PostgreSQL function specifically created to provide the data used in the chart.
The function must follow the conventions defined by CMDBuild to ensure proper integration and correct mapping of output fields.
PostgreSQL Function Specification
A valid chart function must:
- Include the comment
TYPE: functionin the function header - Explicitly define all input parameters (with supported PostgreSQL data types)
- Explicitly define all output fields, each representing a column available for chart configuration
- Return a record set using
RETURNS SETOF record(required for multi‑row output) - Use only supported PostgreSQL data types, such as:
- bigint
- charachter varying
- date
- integer
- numeric
- text
- timestamp
- Avoid returning complex or composite types, unless explicitly supported
Example Structure (for reference only)
Note: the example does not contain specific content and does not represent an official template; it is provided only to illustrate the general structure.
-- TYPE: function
CREATE OR REPLACE FUNCTION my_dashboard_function(start_date date, end_date date)
RETURNS SETOF record AS $$
BEGIN
  RETURN QUERY
  SELECT
    category::text,
    value::numeric
  FROM my_table
  WHERE date_field BETWEEN start_date AND end_date;
END;
$$ LANGUAGE plpgsql;
After Modifying a Function
When a function used by a dashboard is created or updated, it is necessary to clear the CMDBuild cache or restart Tomcat.
This ensures that CMDBuild reloads metadata and recognizes the updated function structure.