Administration Home Dashboard
The home page of the Administration Module provides an overview of key information about the state of the CMDBuild installation. It displays a set of graphs, counters and summary tables that help the Administrator quickly assess the health of the system, understand the configuration footprint and monitor operational elements such as users, tasks and database usage.
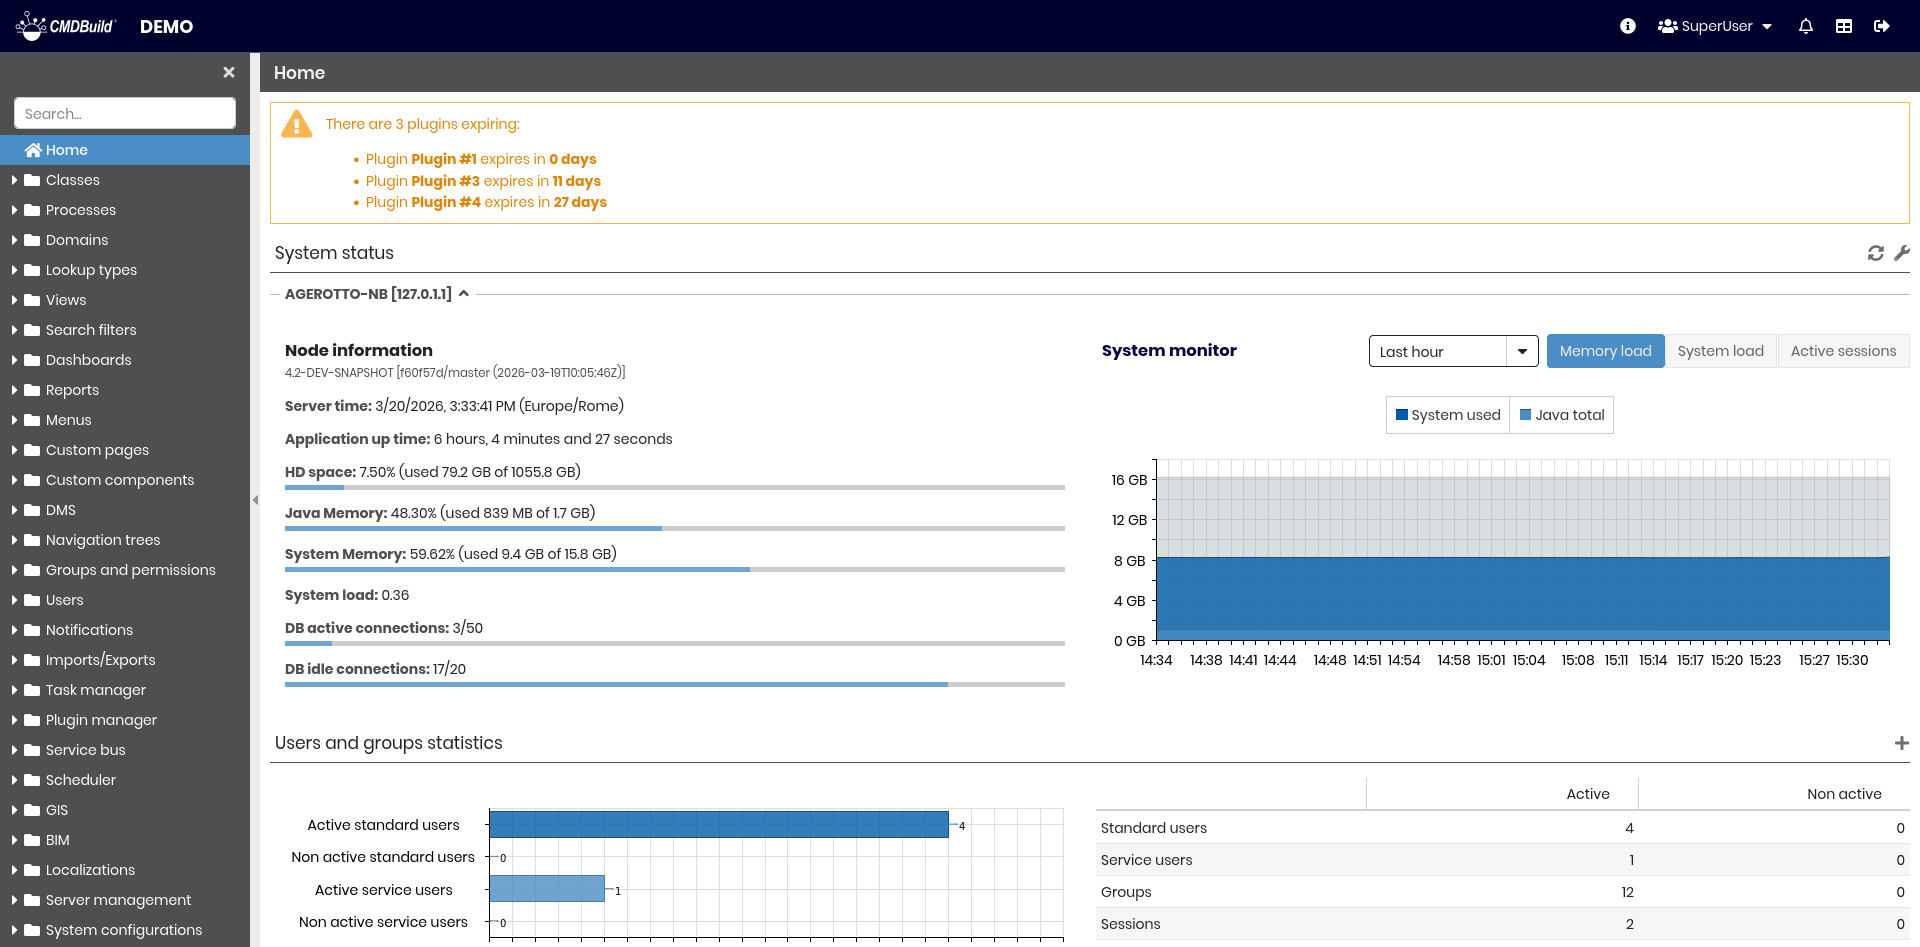
Each section of the dashboard offers shortcuts to the corresponding configuration areas, enabling fast navigation and a more efficient administration workflow.
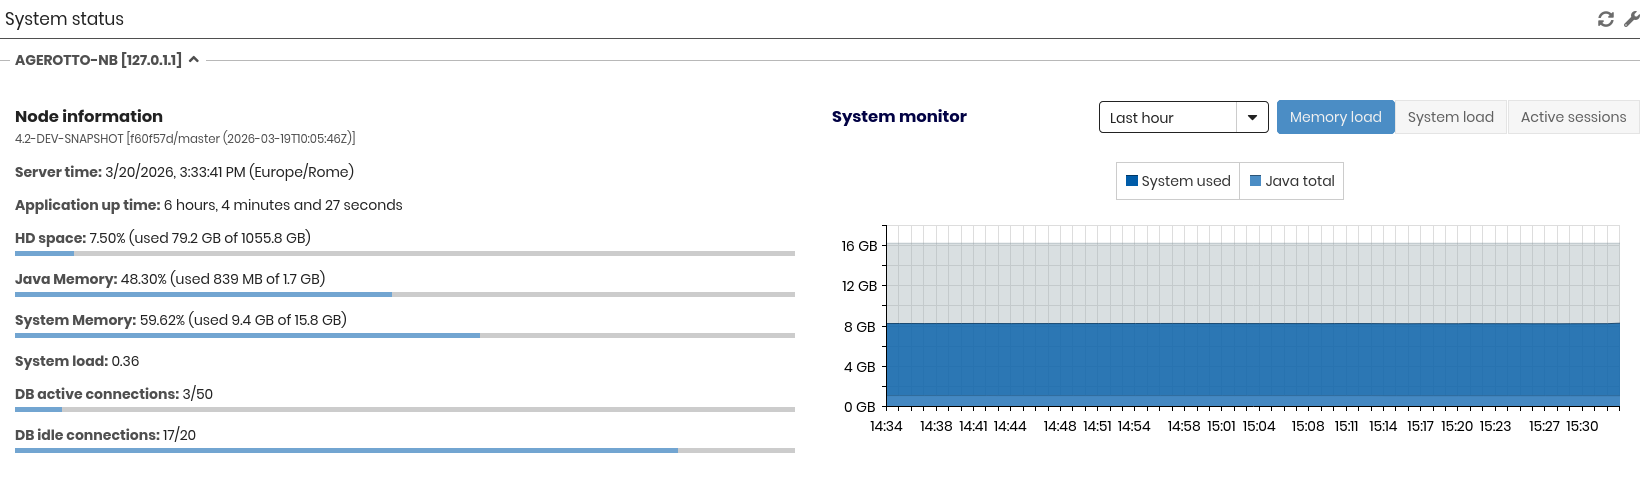
System Status
This section displays a set of graphs that represent the status of each Tomcat node. The information includes used disk space, memory usage, system load and the number of active database connections.
If the system is running in a clustered environment, the dashboard shows a panel for each node.
By clicking the list icon in the upper-right corner of the panel, the Administrator can access a detailed breakdown of all node parameters.
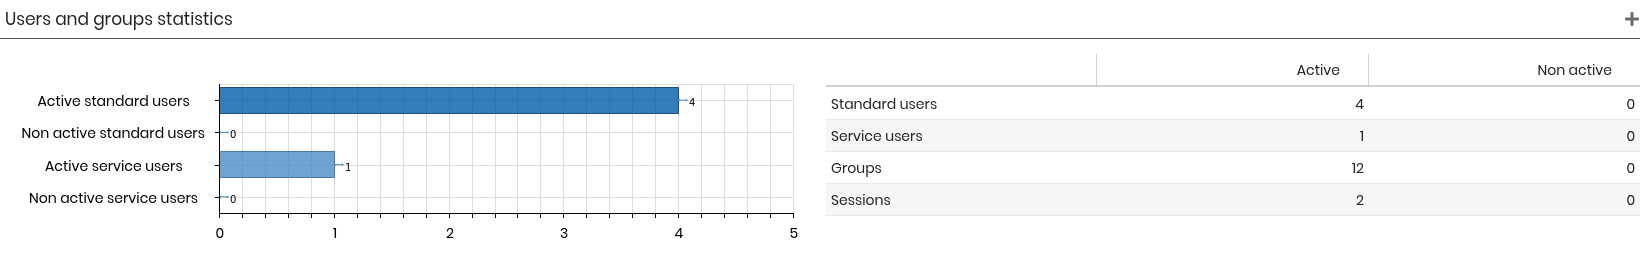
User and Groups Statistics
This graph shows the number of active and inactive users, distinguishing between standard users and service users.
A summary table also displays the number of configured groups and the number of currently active sessions.
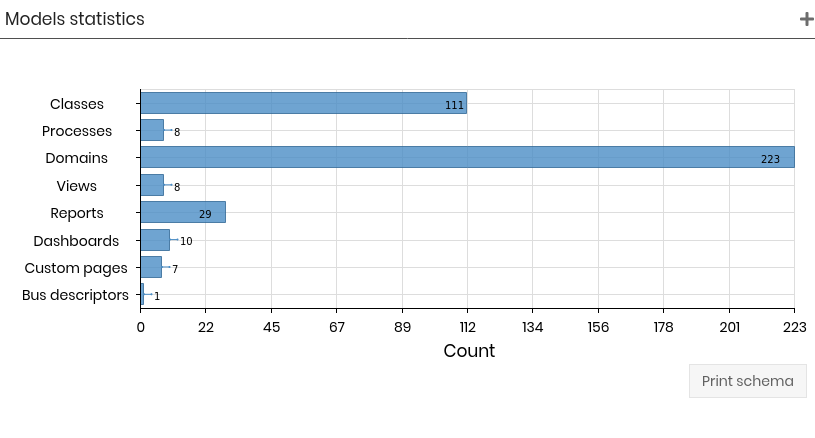
Model Statistics
This section reports the number of elements defined in the data model, grouped by type. The graph includes counts for classes, processes, domains, views, reports, dashboards, custom pages and bus descriptors.
This section also provides the option to export the entire model schema in PDF format by selecting the Print schema button.
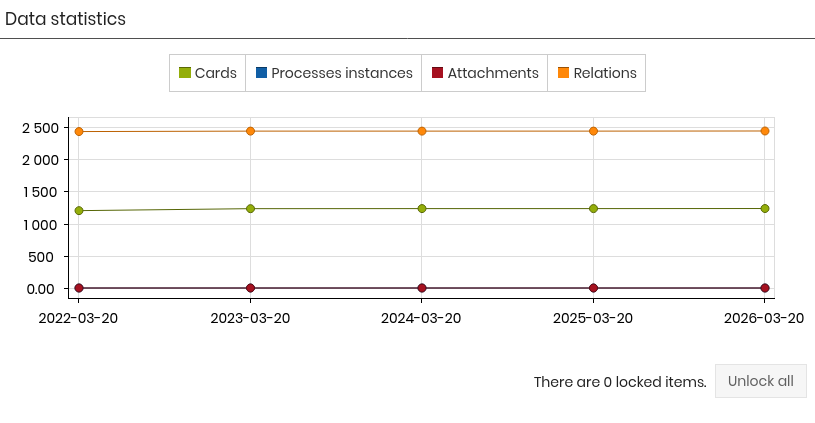
Data Statistics
This section provides a summary of the amount of data stored in the system. The graph displays the number of items for each main data type: cards, process instances, attachments and relations.
An additional indicator shows the number of currently locked cards. The Unlock all button allows the Administrator to clear all active locks and restore normal access to the affected data.
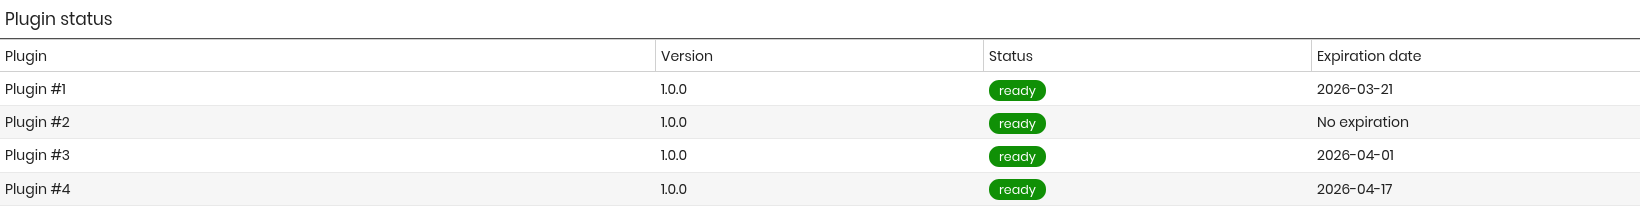
Plugins Status
This section shows a preview of the installed plugins, including their version, activation status and expiration date.
Database Tables Size
This section reports the size of the database. For each table, the dashboard displays the number of records in the active, updated and deleted states, as well as the amount of disk space used.
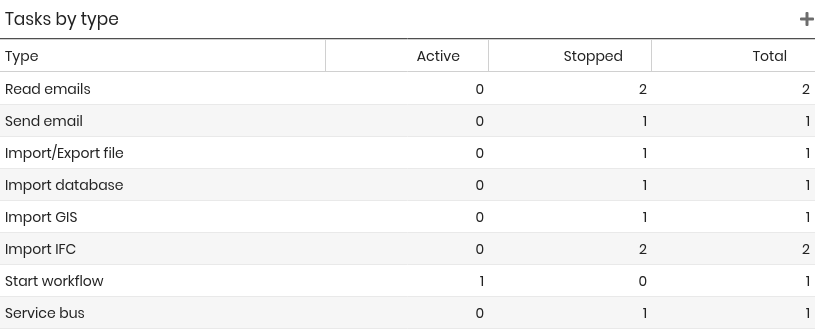
Tasks by Type
This table summarizes the number of tasks configured in the system, grouped by type. For each category, the dashboard shows the number of active and disabled tasks.